Kiel Trade Indicator 2/24
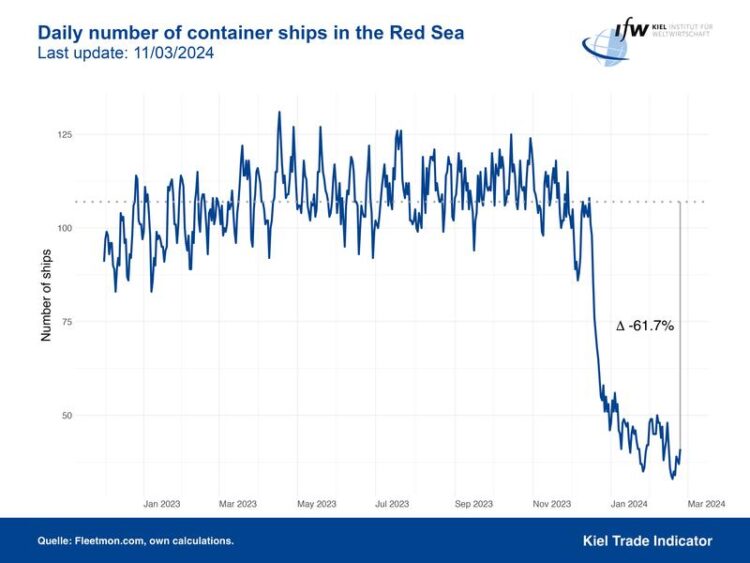
Daily number of container ships in the Red Sea. (c) ifw
Renewed slump of ship transits in the Red Sea after slight stabilization.
The conflict in the Middle East is changing international trade routes at sea. The number of container ships passing through the Red Sea and the Suez Canal fell again in February compared to January. At the same time, the number of ships around the Cape of Good Hope off Africa tripled. However, no greater negative consequences are to be expected for the global economy as a whole or for the German economy in particular, as both freight rates to Europe and the volume of goods arriving in the North Sea are stabilizing. This is according to the latest update of the Kiel Trade Indicator. The algorithm evaluates the global position data of container ships in real time.
At present, around 40 container ships still sail through the Red Sea every day, compared to an average of well over 100 ships last year. The current number of ships is close to the low point of mid-January, having recovered to around 50 ships in the meantime. This means that the slump in shipping traffic in the Red Sea since the beginning of the attacks by the Houthi rebels has not yet been halted.

Average freight rates from China to N. Europe and Global. (c) ifw
However, the consequences for the North Sea ports are easing. Initially, the abrupt interruption of the usual sea route through the Suez Canal led to delays for incoming ships, as they had to take an unplanned detour of around two weeks around the Cape of Good Hope off Africa.
In December and January, around 25 percent fewer ships docked in Hamburg and Bremerhaven, as well as in the ports of Rotterdam and Antwerp, which are important for Germany. In February, the gap closed to around 15 percent, with Bremerhaven even up 2 percent. The reference is the weekly average in 2023.
Freight rates for the transport of a standard container from China to Northern Europe, which previously usually passed through the Suez Canal, are also stabilizing. They have decreased since their peak of just under 6,000 US dollars per standard container in mid-January. Since then, the spot price has been falling continuously and currently stands at around 4,500 US dollars.
The detour around the Cape of Good Hope, which many ships are now taking to avoid the Suez Canal, is apparently also increasing traffic on the world’s oceans. Shipping companies now deploy more ships in order to ensure a tight port schedule. The number of container ships at sea each day rose slightly by 0.3 percent from January to February and currently stands at around 5,450 container ships.
“Even if the overall economic consequences are manageable: The renewed interruption of the usual trade routes through the bottleneck of the Red Sea is meeting with a sensitized mood for geo-economic risks and dependencies,” says Julian Hinz, Research Director and Head of the Kiel Trade Indicator at the Kiel Institute.
“But we should always bear this in mind: Germany and Europe are economically prosperous because they are open economies that thrive on trade. The learning must therefore be to think about diversification, not isolation. All of this speaks in favor of diversifying supply chains and trading partners in order to reduce dependencies on individual suppliers, countries, and trade routes.”
We are currently improving the algorithm of the Kiel Trade Indicator. During this time, updates will be done irregularly at the beginning of a month and without numbers for imports and exports. The improved algorithm will be ready by early summer.
Further charts and more information on the Kiel Trade Indicator can be found at www.ifw-kiel.de/tradeindicator (https://www.ifw-kiel.de/topics/international-trade/kiel-trade-indicator/).
About the Kiel Trade Indicator
The Kiel Trade Indicator estimates trade flows (imports and exports) of 75 countries worldwide, the EU, and world trade as a whole. Specifically, the estimates cover over 50 individual countries as well as regions such as the EU, sub-Saharan Africa, North Africa, the Middle East, or emerging Asia. It is based on the evaluation of ship movement data in real time. An algorithm programmed at the Kiel Institute uses artificial intelligence to analyze the data and translates the ship movements into price and seasonally adjusted growth figures compared with the previous month.
We update the data once a month around the 5th and then present the latest calculations for trade in the current and the previous month.
Arriving and departing ships are recorded for 500 ports worldwide. In addition, ship movements in 100 maritime regions are analyzed and the effective utilization of container ships is derived from draught information. Country-port correlations can be used to generate forecasts, even for countries without their own deep-sea ports.
Compared to other leading trade indicators, the Kiel Trade Indicator is available much earlier, is much more comprehensive, relies on a uniquely large database using big data, and has a low statistical error by comparison. The algorithm of the Kiel Trade Indicator uses machine learning, so that the quality of the forecast continues to improve over time.
Media Contact:
Mathias Rauck
Press Officer
T +49 431 8814-411
mathias.rauck@ifw-kiel.de
Kiel Institute for the World Economy
Kiellinie 66 | 24105 Kiel | Germany
T +49 431 8814-1
E info@ifw-kiel.de
www.ifw-kiel.de
Wissenschaftliche Ansprechpartner:
Prof. Dr. Julian Hinz
Trade Policy
T +49 431 8814-507
julian.hinz@ifw-kiel.de
Media Contact
All latest news from the category: Business and Finance
This area provides up-to-date and interesting developments from the world of business, economics and finance.
A wealth of information is available on topics ranging from stock markets, consumer climate, labor market policies, bond markets, foreign trade and interest rate trends to stock exchange news and economic forecasts.


Newest articles

Faster, more energy-efficient way to manufacture an industrially important chemical
Zirconium combined with silicon nitride enhances the conversion of propane — present in natural gas — needed to create in-demand plastic, polypropylene. Polypropylene is a common type of plastic found…

Energy planning in Ghana as a role model for the world
Improving the resilience of energy systems in the Global South. What criteria should we use to better plan for resilient energy systems? How do socio-economic, technical and climate change related…

Artificial blood vessels could improve heart bypass outcomes
Artificial blood vessels could improve heart bypass outcomes. 3D-printed blood vessels, which closely mimic the properties of human veins, could transform the treatment of cardiovascular diseases. Strong, flexible, gel-like tubes…