NASA examines Peru's deadly rainfall
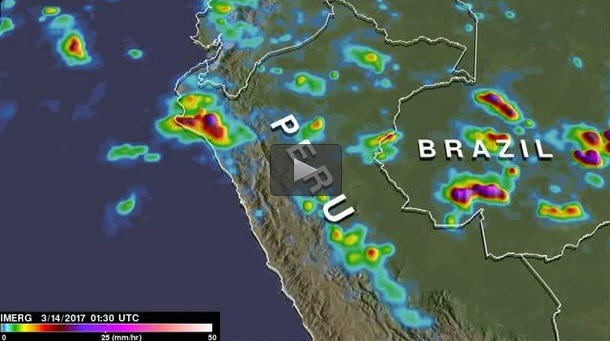
NASA's IMERG rainfall estimates were based on data collected during the period from March 14 to 21, 2017. Purple areas indicate the heaviest rainfall rates, where rain was falling at a rate of between 25 mm (~1 inch) and 50 mm (~2 inches) per hour. Credits: NASA/JAXA, Hal Pierce
Extreme flooding and frequent landslides that occurred in March have forced many from their homes. An El Niño-like condition with warm ocean waters developed near Peru's coast. This extremely warm water off Peru's western coast has been blamed for promoting the development of these storms. Equatorial sea surface temperatures (SSTs) are about average elsewhere in the central and east central Pacific.
When the GPM core observatory satellite flew above Peru on March 20, 2017 at 0826 UTC (4:26 a.m. EST) GPM identified locations of storms that were dropping heavy rainfall over northwestern Peru. Data collected by GPM's Microwave Imager (GMI) and Dual-Frequency Precipitation Radar (DPR) instruments during this pass revealed that very heavy precipitation was falling in that area.
GPM's radar (DPR Ku Band) data indicated that some storms were dropping rain at the extreme rate of greater than 137 mm (5.4 inches) per hour. These extreme rainfall rates were found in the line of storms extending southwestward from Peru's coast.
The GPM satellite's Radar (DPR Ku Band) were also used to examine the 3-D structure of precipitation within the storms near and over northwestern Peru. GPM's examination showed that several storms located in the Pacific had cloud tops that were reaching altitudes above 13 km (8.1 miles). GPM is a joint mission between NASA and the Japanese space agency JAXA.
Integrated Multi-satellitE Retrievals for GPM (IMERG) data were used to show rainfall in areas that were not covered by the GPM core observatory satellite swath. Those estimates are the result of unifying precipitation measurements from a constellation of research and operational satellites. Those rainfall estimates were generated by NASA's Precipitation Processing System every half hour.
That data was made into an animation at NASA's Goddard Space Flight Center in Greenbelt, Maryland and showed real-time IMERG rainfall estimates based on data collected during the period from March 14 to 21, 2017. The animation of seven days of data showed scattered storms developing over Peru and Brazil and moving over Peru. The animation showed rainfall rates between 25 mm (~1 inch) and 50 mm (~2 inches) per hour in many storms.
On March 18, Peru's National Meteorological and Hydrological Service noted that from March 19 to 25, “rains will intensify on the north coast and the entire western slope of the Sierra. On the north coast (La Libertad, Lambayeque, Piura and Tumbes) heavy rains accompanied by [lightning] will intensify between March 19 and 23. In the interior of Piura and Lambayeque, the rainfall is expected to exceed 150 mm per day (~6 inches); while in the coastal zone of Piura, Lambayeque, Tumbes and the interior of La Libertad, it could exceed 50 mm per day (~ 2 inches). “
###
For updated conditions in Peru, visit Peru's National Meteorological and Hydrological Service website: http://www.
Media Contact
All latest news from the category: Earth Sciences
Earth Sciences (also referred to as Geosciences), which deals with basic issues surrounding our planet, plays a vital role in the area of energy and raw materials supply.
Earth Sciences comprises subjects such as geology, geography, geological informatics, paleontology, mineralogy, petrography, crystallography, geophysics, geodesy, glaciology, cartography, photogrammetry, meteorology and seismology, early-warning systems, earthquake research and polar research.


Newest articles

A universal framework for spatial biology
SpatialData is a freely accessible tool to unify and integrate data from different omics technologies accounting for spatial information, which can provide holistic insights into health and disease. Biological processes…

How complex biological processes arise
A $20 million grant from the U.S. National Science Foundation (NSF) will support the establishment and operation of the National Synthesis Center for Emergence in the Molecular and Cellular Sciences (NCEMS) at…
Airborne single-photon lidar system achieves high-resolution 3D imaging
Compact, low-power system opens doors for photon-efficient drone and satellite-based environmental monitoring and mapping. Researchers have developed a compact and lightweight single-photon airborne lidar system that can acquire high-resolution 3D…