Former Tropical Cyclone Kate examined by GPM, RapidScat and GOES-East
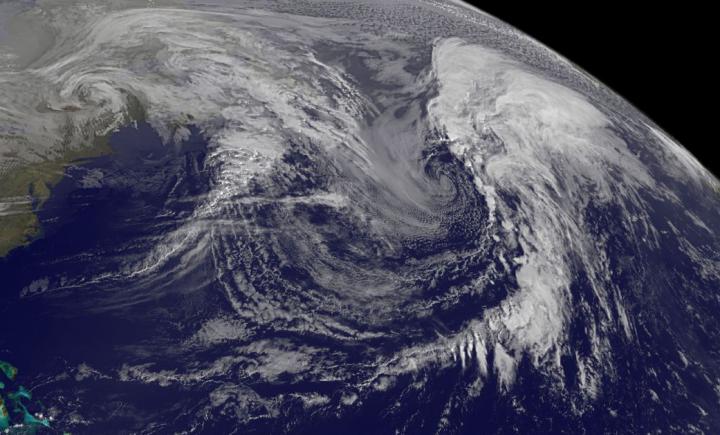
On Nov. 13 at 1145 UTC (7:45 a.m. EST), the NOAA's GOES-East satellite saw the low pressure system formerly known as extra-tropical storm Kate was in the Northern Atlantic Ocean, far to the south of Greenland. Credits: NASA/NOAA GOES Project
Kate became the twelfth named tropical cyclone of the of the 2015 Atlantic hurricane season when it formed near the southeastern Bahamas on Sunday November 8, 2015. Kate re-curved toward the northeast and moved harmlessly over the open waters of the Atlantic. Kate's intensity peaked on November 11, 2015 with winds of about 65 knots making it a category one hurricane on the Saffir-Simpson Hurricane.
The GPM core observatory satellite flew above Kate on November 11, 2015 at 0926 UTC (4:26 a.m. EST) capturing data. Kate's maximum sustained winds were estimated at about 60 knots (69 mph) at that time making it a strong tropical storm.
GPM's Dual-Frequency Precipitation Radar (DPR) sliced through Kate's western side and found that intense storms within feeder bands there were dropping rain at a rate of over 80 mm (3.1 inches) per hour. A 3-D cross section by GPM's Radar (DPR Ku Band) through Kate's weak eye showed intense storms swirling around the northern side of the tropical cyclone. GPM is managed by both NASA and the Japan Aerospace Exploration Agency.
Kate merged with a baroclinic zone over the north Atlantic and became an extra-tropical cyclone on November 12, 2015. A baroclinic zone is a region in which a temperature gradient exists on a constant pressure surface. Baroclinic zones are favored areas for strengthening and weakening system.
On Nov. 12, the RapidScat instrument that flies aboard the International Space Station measured the surface winds associated with the low pressure area. RapidScat showed that strongest winds were in the northwestern and southeastern quadrants near 32 meters per second (71.5 mph/115.2 kph).
Winds around the southwestern quadrant were weakest, while the northeastern side of the storm averaged wind speeds around 20 meters per second (44.7 mph/72 kph).
On Nov. 13 at 1145 UTC (7:45 a.m. EST), the NOAA's GOES-East satellite saw the low pressure system formerly known as extra-tropical storm Kate was in the Northern Atlantic Ocean, far to the south of Greenland. An image of the storm was created by the NASA/NOAA GOES Project at NASA's Goddard Space Flight Center in Greenbelt, Maryland.
The image showed the low pressure center near 41 degrees north latitude and 47 degrees west longitude, and clouds associated with the cold front stretched south and west of the center toward the Bahamas. The low pressure center and associated cold front continued tracking to the east, across the Atlantic.
Media Contact
All latest news from the category: Earth Sciences
Earth Sciences (also referred to as Geosciences), which deals with basic issues surrounding our planet, plays a vital role in the area of energy and raw materials supply.
Earth Sciences comprises subjects such as geology, geography, geological informatics, paleontology, mineralogy, petrography, crystallography, geophysics, geodesy, glaciology, cartography, photogrammetry, meteorology and seismology, early-warning systems, earthquake research and polar research.


Newest articles

Recovering phosphorus from sewage sludge ash
Chemical and heat treatment of sewage sludge can recover phosphorus in a process that could help address the problem of diminishing supplies of phosphorus ores. Valuable supplies of phosphorus could…

Efficient, sustainable and cost-effective hybrid energy storage system for modern power grids
EU project HyFlow: Over three years of research, the consortium of the EU project HyFlow has successfully developed a highly efficient, sustainable, and cost-effective hybrid energy storage system (HESS) that…
After 25 years, researchers uncover genetic cause of rare neurological disease
Some families call it a trial of faith. Others just call it a curse. The progressive neurological disease known as spinocerebellar ataxia 4 (SCA4) is a rare condition, but its…