NASA provides an infrared look at Hurricane Joaquin over time
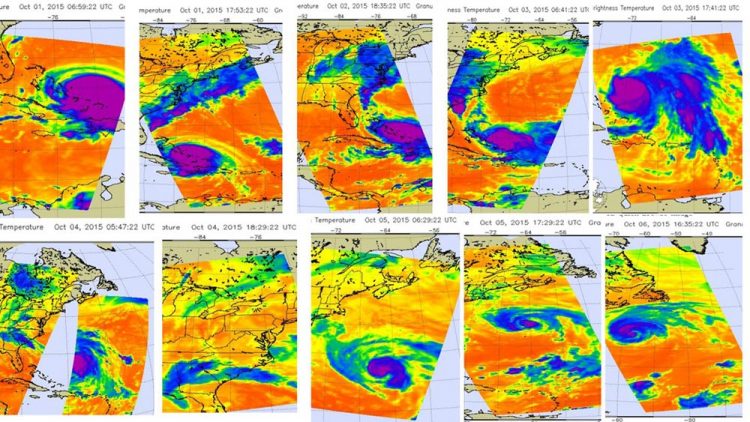
This series of infrared images of Hurricane Joaquin from Oct. 1-6 show the development and movement of the storm, and its moisture stream into South Carolina. Credits: NASA JPL/Ed Olsen
The Atmospheric Infrared Sounder or AIRS instrument flies aboard NASA's Aqua satellite, which circles the Earth twice a day. AIRS gathers temperature data using infrared light, and took many images of Hurricane Joaquin from October 1 through October 6.
NASA put together a timeline of the infrared imagery showing the movement of Hurricane Joaquin and the plume of moisture connected to the Category Four storm that streamed over South Carolina.
The AIRS imagery showed Joaquin over the Bahamas on October 1 and then as it moved north, connected with another weather system that brought intense rainfall and both inland and coastal flooding to South Carolina.
That moisture plume is visible on the AIRS imagery from October 2 through October 4 where thunderstorms with very high, cold cloud tops made a line from the Bahamas to the U.S. mainland. Cloud top temperatures in the line of storms were as cold as or colder than -63 Fahrenheit/-53 Celsius. NASA research has shown that cloud tops that cold can produce heavy rain.
Cloud top temperatures around the eye of Hurricane Joaquin were even colder. Some cloud tops were in excess of -81F/-63C/210K.
Looking at Joaquin's Winds
As AIRS looked at cloud top temperatures another NASA instrument looked at surface wind speed in Joaquin. On October 7 at 12:00 a.m. EDT, the RapidScat instrument that flies aboard the International Space Station saw the sustained winds in Hurricane Joaquin. Strongest winds measured 40.5 meters per second (90.6 mph/145.8 kph) in all quadrants of the storm except the northeastern quadrant where winds were less intense. RapidScat measures wind speed at the surface which is always lower than speeds at higher altitude.
Where is Joaquin Now?
At 11 a.m. EDT (1500 UTC) on October 7, 2015 the center of Tropical Storm Joaquin was located near latitude 41.0 North and longitude 45.6 West. That's about 540 miles (870 km) southeast of Cape Race Newfoundland, Canada. Joaquin was moving toward the east-northeast near 35 mph (56 km/h) and the National Hurricane Center expects that motion to continue for the next day or two with some decrease in forward speed forecast on Friday.
Maximum sustained winds have decreased to near 70 mph (110 kph) and some weakening is forecast during the next 48 hours. Joaquin is forecast to become a large extratropical cyclone by Thursday.
Media Contact
All latest news from the category: Earth Sciences
Earth Sciences (also referred to as Geosciences), which deals with basic issues surrounding our planet, plays a vital role in the area of energy and raw materials supply.
Earth Sciences comprises subjects such as geology, geography, geological informatics, paleontology, mineralogy, petrography, crystallography, geophysics, geodesy, glaciology, cartography, photogrammetry, meteorology and seismology, early-warning systems, earthquake research and polar research.


Newest articles

A universal framework for spatial biology
SpatialData is a freely accessible tool to unify and integrate data from different omics technologies accounting for spatial information, which can provide holistic insights into health and disease. Biological processes…

How complex biological processes arise
A $20 million grant from the U.S. National Science Foundation (NSF) will support the establishment and operation of the National Synthesis Center for Emergence in the Molecular and Cellular Sciences (NCEMS) at…
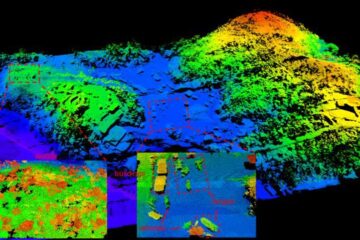
Airborne single-photon lidar system achieves high-resolution 3D imaging
Compact, low-power system opens doors for photon-efficient drone and satellite-based environmental monitoring and mapping. Researchers have developed a compact and lightweight single-photon airborne lidar system that can acquire high-resolution 3D…