Physics Formula to Develop Map-making Computer Program
Researchers at the University of Michigan have developed a new technique for drawing maps that could provide a valuable tool for showing human data such as census findings, election results or disease incidence.
The new technique produces cartograms—maps where sizes of areas on the map are in proportion to the population or some other variable, said Mark Newman, assistant professor of physics in the College of Literature, Science, and the Arts. Newman wrote a paper on the technique, which appeared in the May 19 issue of the Proceedings of the National Academy of Sciences, with graduate student and research assistant Michael Gastner.
Making maps of this kind is not a new idea, but until now the methods that existed for drawing cartograms often yielded maps that were difficult to read or maps with badly distorted shapes.
Newman and Gastner applied a fundamental physics formula, usually used to solve diffusion problems like those associated with gases, to “diffuse” the populations of people in the mapped area. Typically populations are very non-uniform, with more people in cities and fewer in outlying areas. Using the formula, they diffused the populations in the mapped area from densely populated areas to less populated areas—similar to the way a gas naturally diffuses in air—until the population was spread out uniformly. Then they redrew the map with the resulting boundaries. The process is done on a computer, Newman said.
The computer program and the maps it produces provide a useful visualization tool with important scientific applications, such as studies of the geographic distribution of cancer cases.
The first researcher to look at using computer algorithms for drawing cartograms also worked at U-M, Newman said, a detail that added an interesting historical perspective to the project. Waldo Tobler taught at U-M from 1961 to 1977 and was one of the first scientists to develop computer cartograms. Newman and Gastner cited two of Tobler’s publications in the pending PNAS paper.
Tobler commended the paper, saying, “It’s a very nice paper using a rather obvious, but not previously implemented, idea,” he said. “It is curious that nobody, myself included, thought of it before. The mathematics required is rather advanced, and probably beyond what most people who make this kind of map know.” Tobler is retired from the Geography Department of the University of California, Santa Barbara, but continues to publish.
Media Contact
All latest news from the category: Information Technology
Here you can find a summary of innovations in the fields of information and data processing and up-to-date developments on IT equipment and hardware.
This area covers topics such as IT services, IT architectures, IT management and telecommunications.


Newest articles

Properties of new materials for microchips
… can now be measured well. Reseachers of Delft University of Technology demonstrated measuring performance properties of ultrathin silicon membranes. Making ever smaller and more powerful chips requires new ultrathin…

Floating solar’s potential
… to support sustainable development by addressing climate, water, and energy goals holistically. A new study published this week in Nature Energy raises the potential for floating solar photovoltaics (FPV)…
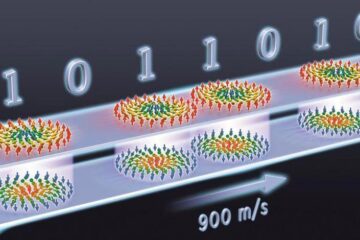
Skyrmions move at record speeds
… a step towards the computing of the future. An international research team led by scientists from the CNRS1 has discovered that the magnetic nanobubbles2 known as skyrmions can be…