Data Visualization Tool Finds "Unknown Unknowns"
The new data analysis and visualization tool offers improved ease of use compared to similar tools, the researchers say, and could be readily adapted for use with existing data sets in a variety of disciplines.
The data analysis and visualization tool is a subset of the Test Matrix Tool (TMT), a multi-component system developed by GTRI for designing, executing and analyzing large-scale modeling and simulation data sets. The visualization capability offers a graphical user interface that provides both on-screen data-manipulation features like filters and the ability to see query results in the form of graphical images almost instantly.
“Data visualization supports data analysis by letting users pose data-related questions onscreen with ease and then view the answers in ways that go far beyond ordinary table formats,” said Edward Clarkson, a GTRI research scientist who is leading the data visualization work. “A picture can be worth a thousand numbers, because visualizing data in a graph allows us to see patterns that might not be apparent from purely numerical results.”
Development of the Test Matrix Tool and its components is being led by Greg Rohling, a GTRI principal research engineer. Rohling’s team developed the TMT to support modeling and simulation investigations into the effectiveness and optimization of numerous U.S. defense systems, including electronic warfare equipment used to protect military aircraft. The work is supported by the Warner Robins Air Logistics Center at Robins Air Force Base.
In developing a simulation test, Test Matrix Tool users can specify desired variations in input parameters using multiple data filters. The TMT system executes all possible combinations of those parameters, creating a test matrix. It then executes the simulations on a Sun/Oracle Grid Engine and stores the resulting simulation output data in a MySQL database.
At that point, TMT’s data analysis component, which includes the data visualization tool, helps users evaluate the often complex test results. By collating the test matrix input and output, the data analysis tools allow users to efficiently filter and visualize test matrix data.
The Test Matrix Tool is designed for use on personal computers. It works under the Linux and Microsoft Windows operating systems.
Some TMT capabilities, including the data analysis and visualization components, could be useful for scrutinizing information gathered in many disciplines, Clarkson said. He mentioned health care as one field where a multitude of existing data sets could be mined for new insights.
“For example, there’s an enormous amount of data out there on heart patients,” he said. “Our data tools could be used to investigate existing patient information and seek significant trends in the data.”
Clarkson explained that users would face the challenge of organizing legacy data sets into formats that the GTRI data analysis software can exploit. But that task, he added, is generally straightforward and can be performed with automated tools in many cases.
The data format required by the TMT tools, he explained, is not particularly complex. What’s needed is a standard database setup in which the information fields are organized into tabular formats. Moreover, any required metadata – special data that tell the system how to deal with a particular data set – would likely present few development issues.
Clarkson recently demonstrated the capabilities of the data analysis and visualization tool using an existing database: baseball statistics. This particular demonstration involved the use of 40 different data filters available onscreen; the TMT system allows for 300 or more such filters.
In a random query of the 46,000 National League players from the past, an onscreen graph unexpectedly revealed an interesting anomaly during the demonstration. The data indicate that players’ height and weight increased in every past decade except the 1920s and 1930s, when it stayed inexplicably flat.
“That’s the beauty of this kind of tool – it can find the unknown unknowns,” Clarkson observed. “Details show up in graphs that aren’t obvious when you’re looking at just the numbers.”
The TMT data visualization tool, he explained, bears some similarities to the data filtering features found on some websites. For example, many shopping sites let users search for products by using filters to select desired qualities such as size, color and brand name.
However, Clarkson said, TMT’s capabilities are considerably more advanced. Whereas commercial systems stop at the filtering stage, the TMT data analysis tools allow fundamental manipulation of the data. Using filters, investigators can transform the data mathematically, a process that makes unique insights and discoveries possible.
“Data analysis and visualization are great for finding many things you want to know,” Clarkson said. “But another real advantage is that they can detect what you perhaps don’t want to know – the bugs and the anomalies — the things that just aren’t right and have to be fixed.”
Research News & Publications Office
Georgia Institute of Technology
75 Fifth Street, N.W., Suite 309
Atlanta, Georgia 30308 USA
Media Relations Contacts: John Toon (404-894-6986)(jtoon@gatech.edu) or Kirk Englehardt (404-894-6015)(kirk.englehardt@comm.gatech.edu).
Writer: Rick Robinson
Media Contact
More Information:
http://www.gatech.eduAll latest news from the category: Information Technology
Here you can find a summary of innovations in the fields of information and data processing and up-to-date developments on IT equipment and hardware.
This area covers topics such as IT services, IT architectures, IT management and telecommunications.


Newest articles
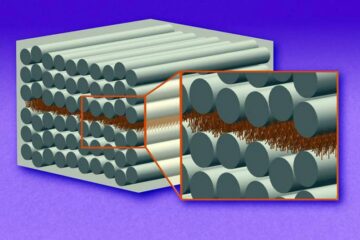
“Nanostitches” enable lighter and tougher composite materials
In research that may lead to next-generation airplanes and spacecraft, MIT engineers used carbon nanotubes to prevent cracking in multilayered composites. To save on fuel and reduce aircraft emissions, engineers…
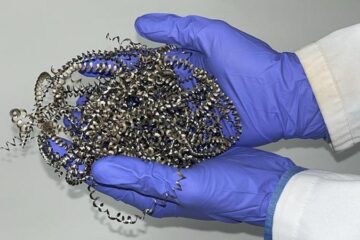
Trash to treasure
Researchers turn metal waste into catalyst for hydrogen. Scientists have found a way to transform metal waste into a highly efficient catalyst to make hydrogen from water, a discovery that…
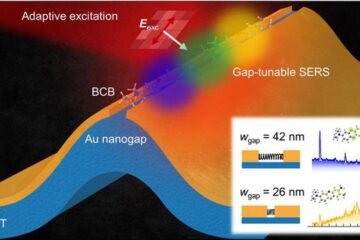
Real-time detection of infectious disease viruses
… by searching for molecular fingerprinting. A research team consisting of Professor Kyoung-Duck Park and Taeyoung Moon and Huitae Joo, PhD candidates, from the Department of Physics at Pohang University…