NASA satellites reveal heavy rains in dangerous Cyclone Yasi on its Australian approach
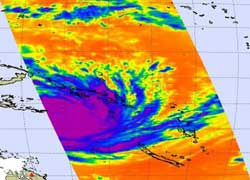
This infrared AIRS image from NASA\'s Aqua satellite was captured on Feb. 1 at 0247 UTC (Jan. 31 at 9:47 p.m. EST/12:47 p.m. Australia/Brisbane local time) and the storm appears to fill up most of the Coral Sea. The western fringes of the storm were over the Solomon Islands and Vanuatu at that time. The strongest thunderstorms and heaviest rainfall appear in areas false-colored in purple. The light blue areas are out of the range of the satellite instrument and show no data. Credit: NASA JPL, Ed Olsen<br>
Tropical cyclone Yasi became much more powerful and was upgraded to a dangerous category fpur tropical cyclone on the Saffir Simpson scale on February 1, 2011.
A Cyclone Warning is now in effect for Queensland, Australia for coastal areas from Cape Melville to Sarina, extending inland to east of Croydon to Hughenden. A Cyclone Watch is in effect for coastal areas from Lockhart River to Cape Melville, and in the tropical interior north of Winton to Sarina.
Yasi was seen by the Tropical Rainfall Measuring Mission (TRMM) satellite when it passed over on Febuary 1, 2011 at 0356 UTC (Jan. 31 at 10:56 p.m. EST/1:56 p.m. Australia/Brisbane local time). TRMM precipitation data collected with that pass revealed that intensifying Yasi had a small eye surrounded by powerful thunderstorms. The heaviest rainfall was falling mostly on the south and eastern sides of the storm at a rate of about 2 inches (50 mm) per hour. Most of the rainfall in the rest of the storm was moderate, falling at a rate between .78 to 1.57 inches (20-40 mm) per hour.
The precipitation analysis used TRMM's Microwave Imager (TMI) and Precipitation Radar (PR) data and was overlaid on a visible/infrared image from TRMM's Visible and InfraRed Scanner (VIRS).
Less than one hour before, NASA's Aqua satellite passed over Cyclone Yasi and captured an infrared image of its cold clouds on Feb. 1 at 0247 UTC (Jan. 31 at 9:47 p.m. EST/12:47 p.m. local time). Infrared imagery suggests that the storm appears to fill up most of the Coral Sea, and provided scientists with a 10 nautical mile-wide eye measurement of the storm.
At the time of the AIRS image, the western fringes of the storm were exiting the Solomon Islands and Vanuatu. The strongest thunderstorms and heaviest rainfall were around the center of the storm, and cloud top temperatures in those areas were as cold as or colder than -63 degrees Fahrenheit (-52 Celsius)!
Another satellite passed over Cyclone Yasi earlier. The Moderate Resolution Imaging Spectroradiometer (MODIS) instrument onboard NASA's Terra satellite captured a visible image of Cyclone Yasi approaching Australia at 00:00 UTC (7 p.m. EST Jan. 31/10 a.m. local time) on February 1, 2011. Yasi's eye was visible in the image, despite some clouds wrapping into its center.
At 1500 UTC (10 a.m. EST, Feb. 1 / 1 a.m. Feb. 2, Australia/Brisbane local time) on February 1, 2011, Cyclone Yasi was packing maximum sustained winds near 120 knots ( 138 mph/ 222 kmh) with higher gusts. That makes Yasi a Category four (out of five) hurricane on the Saffir-Simpson scale. Cyclone-force winds were occurring as far as 50 nm from the center. It was located about 450 miles (724 km) east-northeast of Cairns, Australia near 14.9 South and 153.2 East. It was moving west-southwest near 17 knots (~20 mph/ ~32 kmh).
Cyclone Yasi is a powerful and dangerous storm and is generating waves up to 38 feet (11.5 meters) in the Coral Sea.
Unfortunately, the system is expected to continue to intensify due to good outflow, low vertical wind shear (winds that if strong enough can weaken a tropical cyclone) and warm sea surface temperatures.
The Joint Typhoon Warning Center forecasts that the storm will make landfall near Cairns in Queensland by Wednesday, February 2 near 1200 UTC (7 a.m. EST/10 a.m. local time ) at a provisionally forecast strength of 130 knots (149 mph/240 kmh), which is just under being classified as a Category 5 cyclone.
Residents of Queensland should check the Australian Bureau of Meteorology's website for storm updates at: http://www.bom.gov.au/cyclone/ and should heed evacuations and emergency preparedness immediately.
Media Contact
More Information:
http://www.nasa.govAll latest news from the category: Earth Sciences
Earth Sciences (also referred to as Geosciences), which deals with basic issues surrounding our planet, plays a vital role in the area of energy and raw materials supply.
Earth Sciences comprises subjects such as geology, geography, geological informatics, paleontology, mineralogy, petrography, crystallography, geophysics, geodesy, glaciology, cartography, photogrammetry, meteorology and seismology, early-warning systems, earthquake research and polar research.


Newest articles

“Nanostitches” enable lighter and tougher composite materials
In research that may lead to next-generation airplanes and spacecraft, MIT engineers used carbon nanotubes to prevent cracking in multilayered composites. To save on fuel and reduce aircraft emissions, engineers…

Trash to treasure
Researchers turn metal waste into catalyst for hydrogen. Scientists have found a way to transform metal waste into a highly efficient catalyst to make hydrogen from water, a discovery that…
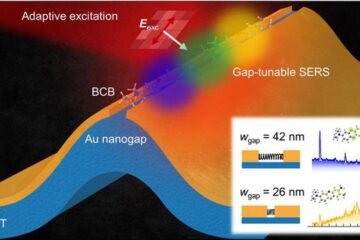
Real-time detection of infectious disease viruses
… by searching for molecular fingerprinting. A research team consisting of Professor Kyoung-Duck Park and Taeyoung Moon and Huitae Joo, PhD candidates, from the Department of Physics at Pohang University…