NASA Satellites Capture Hurricane Sandy's Massive
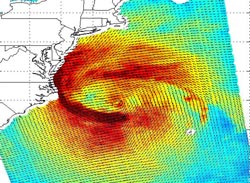
This image shows ocean surface winds for Hurricane Sandy observed at 9:00 p.m. PDT Oct. 28 (12:00 a.m. EDT Oct. 29) by the OSCAT radar scatterometer on the Indian Space Research Organization's (ISRO) OceanSat-2 satellite. Colors indicate wind speed and arrows indicate direction. The image shows the large extent of high winds associated with this system. Radar scatterometry enables frequent, more than once per day, observations of Earth's winds over the ocean. This provides additional information to weather forecasters to improve predictions of what areas will be affected by hurricane-level winds. Image credit: ISRO/NASA/JPL-Caltech<br>
NASA's CloudSat spacecraft overpassed Hurricane Sandy on Oct. 29, 2012 at approximately 11:25 a.m. PDT (2:25 p.m. EDT) just as Sandy was approaching the Atlantic coastline. Sandy contained estimated maximum sustained winds of 90 miles per hour (78 knots).
CloudSat, flying in formation with the A-TRAIN constellation of satellites, provides detailed radar observations of clouds including the vertical distribution of precipitation and cloud structure. At the expense of horizontal resolution, CloudSat observations produce detailed vertical resolution of clouds and precipitation starting at the surface through 19 miles (30 kilometers) in the atmosphere. CloudSat profiles the clouds and distinguishes the amount and type of water, liquid or ice, found throughout these storm systems.
CloudSat overpassed an estimated 137 miles (220 kilometers) to the west of Sandy's storm center, which at the time of the overpass was still over the Atlantic Ocean. The satellite overpassed a wide area of moderate precipitation stretching across New York to coastal North Carolina. Maximum cloud top heights from the CloudSat overpass are estimated at 7.5 to 8 miles (12 to 13 kilometers) in height. The brighter colors (orange, red and light pinks) represent greater intensity of the backscattered radar signal from the satellite. These brighter colors correlate to larger raindrops, heavier precipitation and ice or hail depending on the vertical level. The shades of blues and greens represent smaller amounts water and ice particles that correspond to thinner clouds type (cirrus and anvil tops). A nearly continuous area of light and moderate precipitation stretches across the mid-Atlantic region. Near the surface of these areas of light to moderate precipitation, the radar signal measured by CloudSat isn’t as strong due to larger sized water droplets that tend to weaken the strength of the signal. The CloudSat observations are an excellent tool for determining cloud layers and heights, precipitating cloud structures and other cloud properties.
Part of the CloudSat overpass over the ocean just off the coast of Virginia and North Carolina (denoted by blue line) reveals small pockets of shallow “closed cell” cumulus clouds less than 1.2 miles (2 kilometers) in height. Closed cell cumulus clouds generally represent more stable atmospheric conditions and occur on the back side of mid-latitude cyclones as is the case with Sandy moving onshore.
NASA's Aqua satellite captured a visible image Sandy's massive circulation. Sandy covers 1.8 million square miles, from the Mid-Atlantic to the Ohio Valley, into Canada and New England.
The Moderate Resolution Imaging Spectroradiometer (MODIS) instrument aboard NASA's Aqua satellite captured a visible image Sandy's massive circulation on Oct. 29 at 18:20 UTC (2:20 p.m. EDT). Sandy covered 1.8 million square miles, from the Mid-Atlantic to the Ohio Valley, into Canada and New England. Sandy made landfall hours after the MODIS image was taken.
Sandy Was Still a Hurricane After Landfall
On Oct. 29, 2012 at 11 p.m. EDT, the center of Hurricane Sandy was just 10 miles (15 km) southwest of Philadelphia, Penn., near 39.8 North and 75.4 West. Sandy was still a hurricane with maximum sustained winds near 75 mph (120 kph) and moving northwest at 18 mph (30 kph). Sandy's minimum central pressure had risen to 952 millibars. The hurricane-force-winds extended 90 miles (150 km) east of the center of circulation. Tropical-storm-force winds, however, went much further, as far as 485 miles (780 km).
NASA's GOES Project created a “full-disk view” of NOAA's GOES satellite data, that captured a global view of Hurricane Sandy's birth to landfall. The animation of NOAA's GOES-13 and GOES-15 satellite observations were combined from Oct. 21-30, 2012 and showed the birth of Tropical Storm Sandy in the Caribbean Sea, the intensification and movement of Sandy in the Atlantic Ocean along the U.S. East Coast, and Hurricane Sandy make landfall in N.J. on Oct. 29 and move inland to Penn.
Sandy's Inland Movement on Oct. 29
At 2 a.m. EDT, on Oct. 29, Sandy's center was located just south of Lancaster, Penn. At 5 a.m. EDT, Sandy continued moving to the west-northwest at 15 knots (24 kph) and was located just 15 miles (24 km) east of York, Penn., and 90 miles (145 km) west of Philadelphia. Sandy was centered near 40.5 North and 77.0 West. Sandy's minimum central pressure continues to rise and was 960 millibars.
Sandy's sustained winds were near 65 mph. Tropical-storm-force winds extend almost 1,000 miles. According to Weather Channel, the winds are going to continue being a problem from the northeast into the Ohio Valley today. The strongest winds are being experienced now in the Great Lakes Region.
Widespread Damages
Hurricane Sandy has caused significant damage in New York City and along the Mid-Atlantic coast. Flooding has been reported from Maine to Va. During the morning hours on Oct. 29 (Eastern Daylight Time), nearly eight million people were without power this morning up and down the East coast. The Appalachian Mtns. received some heavy snow from western Md. down to Tenn. and N.C. As much as 26 inches of snow had fallen in Garrett County, Md. by the morning of Oct. 30. According to Reuters news, flooding along the U.S. East Coast was extensive.
Watches and Warnings in Effect on Oct. 29
According to the NOAA's Hydrometeorological Prediction Center (NOAA/HPC), there are high-wind warnings in effect including gale force winds over the coastal waters of the Mid-Atlantic States, New York and New England. Storm warnings are in effect for portions of the Mid-Atlantic coastal waters. Flood and flash flood watches and warnings are in effect over portions of the Mid-Atlantic and northeastern states.
NOAA's HPC forecast on Oct. 29 calls for Sandy to move in a “west-northwest motion with reduced forward speed is expected today into western Penn. with a turn north into western New York tonight, Oct. 30. The cyclone will move into Canada on Wed., Oct. 31. Steady weakening is forecast during the next 48 hours.”
NOAA/HPC warns that gale-force winds will continue over parts of the Mid-Atlantic through New England on Oct. 29 and storm surge and tides can still cause normally dry areas along or near the coast to be flooded, especially during high tide.
Rain and Snowfall Forecasts from NOAA
NOAA/HPC forecasts large rainfall totals for many areas in Sandy's reach. Far northeastern N.C. could expect 3 to 6 inches, while 4 to 8 inches more are possible over the Mid-Atlantic States on Oct. 30. Both areas can see isolated higher totals. Between 1 and 3 inches are possible with up to 5 inches in the southern tier of New York state and northeastward through New England.
Snowfall between 2 and 3 feet are expected in the W.Va. mountains with higher totals through Oct. 30. Snowfall of 1 to 2 feet in the southwestern Va. and Ky. Mountains are expected, and between 12 and 18 inches along the N.C. and Tenn. Border and in western Md.
NOAA/HPC Provided Selected Rainfall Totals from the Storm:
WASHINGTON DC
WASHINGTON/NATIONAL 4.11
DELAWARE
MILFORD 9.55
DOVER AFB 8.46
WILMINGTON ARPT 4.17
MASSACHUSETTS
EAST MILTON 2.87
FITCHBURG (FIT) 2.32
NANTUCKET MEMORIAL ARPT 2.00
MARYLAND
PATUXENT RIVER NAS 7.90
OCEAN CITY MUNI ARPT 7.16
SALISBURY RGNL ARPT 7.10
BALTIMORE SCIENCE CENTER 6.40
ANNAPOLIS US NAVAL ACADEMY 6.29
BALTIMORE/WASH INTL ARPT 5.93
HAGERSTOWN RGNL ARPT 4.11
NORTH CAROLINA
HATTERAS/BILLY MITCHELL AP 6.26
ELIZABETH CITY MUNI ARPT 3.46
NEW BERN/CRAVEN CO. ARPT 2.34
NEW HAMPSHIRE
JAFFREY MUNI ARPT 3.63
NASHUA/BOIRE FIELD 1.98
MOUNT WASHINGTON 1.87
MANCHESTER AIRPARK 1.56
NEW JERSEY
WILDWOOD CREST 11.62
WEST CAPE MAY 9.37
WOODBINE 7.82
ATLANTIC CITY 8.01
ESTELLE HARBOR 6.57
MILLVILLE MUNI ARPT 5.28
NEW YORK
NIAGARA FALLS INTL ARPT 2.69
JAMESTOWN AIRPORT 2.46
ROCHESTER/MONROE CO. ARPT 2.19
PENN YAN AIRPORT 1.74
BUFFALO FORECAST OFFICE 1.46
OHIO CLEVELAND-HOPKINS INTL ARPT 3.14
ASHTABULA CO. ARPT 2.77
YOUNGSTOWN MUNI ARPT 2.54
WOOSTER/WAYNE CO. ARPT 2.46
AKRON/FULTON INTL ARPT 2.19
NEW PHILADELPHIA/CLEVER FIELD 2.04
AKRON-CANTON RGNL ARPT 2.04
CLEVELAND/BURKE LAKEFRONT 1.51
PENNSYLVANIA LIGONIER 3.62
YORK ARPT 3.27
JOHNSTOWN/CAMBRIA CO. ARPT 3.22
ERIE INTL ARPT 3.01
PHILADELPHIA INTL ARPT 2.36
PITTSBURGH/ALLEGHENY CO. ARPT 2.35
LANCASTER AIRPORT 2.29
HARRISBURG/CAPITAL CITY ARPT 2.20
PHILADELPHIA/NE PHIL. ARPT 1.93
RHODE ISLAND PAWTUCKET/NORTH CENTRAL ST ARPT 1.32
VIRGINIA
OCEANA NAS/SOUCEK 9.54
WALLOPS ISLAND 8.40
PURCELLVILLE 7.89
NEWPORT NEWS/WILLIAMSBG AP 7.31
LANGLEY AFB/HAMPTON 7.17
NORFOLK INTL ARPT 5.91
WASHINGTON/DULLES 4.78
NORFOLK NAS 3.29
RICHMOND 2.39
WEST VIRGINIA
MORGANTOWN/HART FIELD 2.95
SPRINGFIELD 2.77
PARKERSBURG/WILSON 2.01
HUNTINGTON/TRI-STATE ARPT 1.98
WHEELING/OHIO CO. ARPT 1.88
SNOWFALL TOTALS
NORTH CAROLINA
6 N BAKERSVILLE 8 INCHES
6 NW LANSING 5 INCHES
4 NW FAUST 6 INCHES
PENNSYLVANIA
MOUNT DAVIS 9 INCHES
VIRGINIA
1 E TAZEWELL 5 INCHES
WEST VIRGINIA
BOWDEN 14 INCHES
CANVAS 12 INCHES
2 S COAL CITY 12 INCHES
SUMMERSVILLE 10 INCHES
WIND GUSTS
ISLIP NY 90 MPH
2 N TOMPKINSVILLE NJ 90 MPH
SURF CITY NJ 89 MPH
TUCKERTON NJ 88 MPH
1 N MONTCLAIR NJ 88 MPH
PLUM ISLAND NY 84 MPH
CUTTYHUNK MA 83 MPH
GROTON CT 76 MPH
HARVEY CEDARS NJ 75 MPH
Text credit:Rob Gutro
NASA's Goddard Space Flight Center, Greenbelt, Md.
Media Contact
All latest news from the category: Earth Sciences
Earth Sciences (also referred to as Geosciences), which deals with basic issues surrounding our planet, plays a vital role in the area of energy and raw materials supply.
Earth Sciences comprises subjects such as geology, geography, geological informatics, paleontology, mineralogy, petrography, crystallography, geophysics, geodesy, glaciology, cartography, photogrammetry, meteorology and seismology, early-warning systems, earthquake research and polar research.


Newest articles

Properties of new materials for microchips
… can now be measured well. Reseachers of Delft University of Technology demonstrated measuring performance properties of ultrathin silicon membranes. Making ever smaller and more powerful chips requires new ultrathin…

Floating solar’s potential
… to support sustainable development by addressing climate, water, and energy goals holistically. A new study published this week in Nature Energy raises the potential for floating solar photovoltaics (FPV)…

Skyrmions move at record speeds
… a step towards the computing of the future. An international research team led by scientists from the CNRS1 has discovered that the magnetic nanobubbles2 known as skyrmions can be…