Color-coded chart improves parents’ understanding of body mass index (BMI)
A new study shows that parents are more likely to understand a body mass index (BMI) chart if it’s color-coded, like a traffic light, than the standard charts currently in use.
“We think that better communication of BMI from doctor to parent could lead to parents' earlier awareness of their child’s weight status in time to help them make important lifestyle changes,” says Eliana Perrin, M.D., M.P.H., senior and corresponding author of the study and assistant professor of pediatrics at the University of North Carolina at Chapel Hill School of Medicine.
In the study, published in the September/October 2009 issue of journal Academic Pediatrics, a sample of 163 parents of children seen at pediatric clinics at UNC and Vanderbilt University were tested to assess their understanding of BMI, their health literacy and their math abilities.
“Childhood obesity is an American epidemic that bears enormous health and economic costs to everyone,” says Perrin, also a Research Fellow at the UNC Center for Health Promotion and Disease Prevention. “Health professionals need more effective ways of communicating our messages to parents if we want to stem this tide. We have to keep trying to help people understand the concerns their children face now and in the future.”
The BMI portion of the test included some questions that parents were asked to answer using a standard BMI chart and other questions in which they were asked to use a color-coded BMI chart. While the standard chart expresses BMI only in terms of percentiles and their ranges (for example, it shows that a 6-year-old boy with a BMI of 20 falls above the 95th percentile for weight), the color-coded chart uses familiar stop light colors. Green indicates the healthiest zone for BMI, yellow indicates more risk, and red indicates unhealthy BMI zones.
Parents were more than four times as likely to answer the same questions correctly when using color-coded BMI charts than when using standard charts. The color-coded charts were most helpful to parents with the lowest math abilities (those at the kindergarten through 5th grade level). In this group correct answers increased from 51 percent to 81 percent when they used color-coded charts. The study concluded that parents consistently performed better with color-coded charts than standard BMI charts, with those of lowest math skills reaping the largest benefit.
“This study shows the value of simplified communication tools. It's important that parents — all parents — understand what their doctors are telling them. It's one step in a long road to preventing obesity, but parents often don't know when their children are overweight or gaining weight too fast, and they don't want a complicated chart,” Perrin said.
The color-coded chart used in the study was developed by UNC researchers in the Department of Pediatrics and at the Center for Health Promotion and Disease Prevention.
First author of the study is Matthew D. Oettinger, a fourth-year medical student at UNC. The other UNC authors are Joanne P. Finkle, J.D., R.N., Denise Esserman, Ph.D., Lisa Whitehead, M.D., and Steven R. Pattishall, also a fourth-year medical student. The Vanderbilt authors are Russell L. Rothman, M.D., M.P.P. and Thomas K. Spain, medical student.
Media Contact
More Information:
http://www.unc.eduAll latest news from the category: Studies and Analyses
innovations-report maintains a wealth of in-depth studies and analyses from a variety of subject areas including business and finance, medicine and pharmacology, ecology and the environment, energy, communications and media, transportation, work, family and leisure.


Newest articles
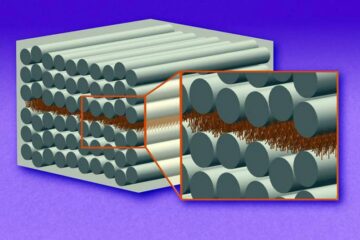
“Nanostitches” enable lighter and tougher composite materials
In research that may lead to next-generation airplanes and spacecraft, MIT engineers used carbon nanotubes to prevent cracking in multilayered composites. To save on fuel and reduce aircraft emissions, engineers…
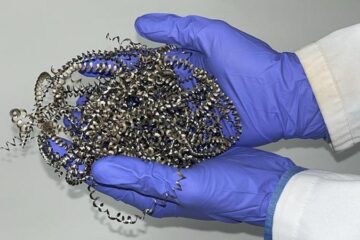
Trash to treasure
Researchers turn metal waste into catalyst for hydrogen. Scientists have found a way to transform metal waste into a highly efficient catalyst to make hydrogen from water, a discovery that…
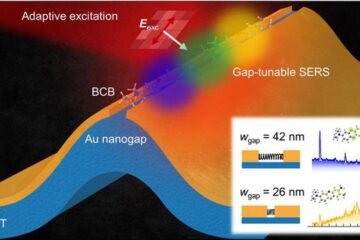
Real-time detection of infectious disease viruses
… by searching for molecular fingerprinting. A research team consisting of Professor Kyoung-Duck Park and Taeyoung Moon and Huitae Joo, PhD candidates, from the Department of Physics at Pohang University…