Software uses pictures to represent info people monitor
If your computer screen is covered with Web browser windows to let you monitor the news headlines, weather, traffic and stock market while you work, you might be suffering from information overload.
Computing researchers at the Georgia Institute of Technology experienced this problem and have created a prototype software program to move such information from the center of your awareness to the periphery. Called InfoCanvas, the program creates an abstract pictorial representation of information people want to monitor. The canvas is displayed on a separate monitor and looks much like a painting hung on a wall or a picture frame set on a desk.
“We wanted people to be able to keep up with the stuff that’s important to them, but not have it get in the way,” said John Stasko, an associate professor of computing at Georgia Tech. “And the art angle is designed to enhance their environment or make it more aesthetically pleasing.”
Stasko and Ph.D. student Todd Miller will present the InfoCanvas concept at an April 7 workshop during the Computer-Human Interaction (CHI) 2003 meeting in Fort Lauderdale, Fla. Other students working on the InfoCanvas project are Shannon Bauman, Julie Isaacs, Jehan Moghazy, Chris Plaue and Zack Pousman.
“This project gets at the idea that a picture is worth a thousand words,” Stasko explained. Ultimately, a proof-of-concept version of InfoCanvas — funded by a National Science Foundation grant to Stasko – will allow users to design the entire scene from the background to every graphical image representing different data elements. Right now, researchers manually code these elements into the software prototype after trial users select their graphics from paper cutouts.
The researchers have developed several InfoCanvas themes — a beach, desert, aquarium, office, view out a window, medieval fantasy and a mountain campsite. Icons on the screen represent various types of information the user monitors. The icons gradually move – but not like animation — to indicate changes in information. Objects can appear or disappear, images change, and images can move along a path, scale up or down, rotate or populate an area (e.g., like a field of flowers) in response to data changes.
If a user is intrigued by something on their InfoCanvas, they can run their mouse over that area to get more information in a pop-up box, or in the case of a stand-alone wall display, users touch the screen to get details. Recently, Miller added actual links to the Web pages generating information in the InfoCanvas.
The researchers emphasize the ability of InfoCanvas to cater to the user’s specific interests.
For example, on Stasko’s InfoCanvas of a beach scene, a sailboat moves left to right to indicate the time of day from 9 a.m. to 6 p.m. Clouds appear in the sky, when appropriate, to indicate the weather in his parents’ hometown. A small seagull moves up and down to indicate the temperature. A large seagull moves left to right with changes in the Dow Jones Index. A crab appears when airfare to San Diego – a forthcoming destination for Stasko – plunges below $300. A towel appears on the beach when Stasko receives email from his wife. A beach-goer’s swimsuit changes colors from green to yellow to red depending on the traffic flow on Interstate 75. And, because he’s a golfer, a sign on Stasko’s beach scene, features the latest image from a golfing Web site.
“Some people want the current news headlines, but we don’t just put text on the screen,” Stasko explained. “It would be something like an airplane flying over with a banner containing headlines. If there’s text, we put it in a billboard or on a TV. The text is situated in a context so it looks like a painting. If you just put text on the screen, it just becomes like any old computer tool – for instance a Web portal like MyYahoo.com.
“That’s fine, but by making the information like a painting on the wall, users can just glance up at it while they’re working during the day,” he added “…. So I can keep up with things, but it doesn’t raise my blood pressure or get me tense. It’s just a complement.”
Miller hypothesizes that gathering information from InfoCanvas is quicker than scanning text on the screen. He and Stasko will test that idea with a study of users who compare InfoCanvas to a Web portal and a page of text in a Web browser. Users will be given seven seconds to view the screen and then recall what they gleaned from it.
Already, three trial users have been testing InfoCanvas in their offices for about two months. “What people picked as important to them has varied, and they have also chosen different levels of details,” said Miller, whose dissertation will focus, in part, on InfoCanvas. “So there’s a lot of personalization going on.”
Two trial users chose the aquarium theme with fish to indicate weather and stock market information. The third user chose the beach scene, which he personalized with a sign featuring the local weather radar image. Drinks appear on his beach when he receives email.
“Our preliminary data from these users shows they enjoy it,” Miller said. “They don’t find it distracting, and they look at it frequently throughout the day.”
The researchers want to achieve a balance between clever information presentation and not distracting the user. “It’s a fine line we’re walking,” Stasko said. “We want to stay on the side of not being too enticing. The changes on the screen are gradual. Nothing is jumping around.”
Researchers plan to test the InfoCanvas on several more users, including some working in home offices and workers who are not information technology specialists.
The project’s goal is to build a “front-end,” proof-of-concept software tool to allow users to easily design their own InfoCanvas. In the meantime, Miller has created an Atlanta-based InfoCanvas that is available for download at www.cc.gatech.edu/gvu/ii/infoart/downloads.html. Its information and icons are preset. Other research into software systems for monitoring information in a peripheral way has led to a Microsoft prototype called “Sideshow.” It creates a sidebar on a display of a docked PDA. And another Georgia Tech research concept dubbed “What’s Happening” cycles information in a small window in the corner of a user’s screen.
For technical information, contact:
1. John Stasko, 404-894-5617 or
E-mail: john.stasko@cc.gatech.edu
2. Todd Miller, 404-385-2447 or
E-mail: tomiller@cc.gatech.edu
Georgia Tech Research News and Research Horizons magazine, along with high-resolution JPEG images, can be found on the Web at gtresearchnews.gatech.edu.
Complimentary press registration for CHI 2003 is available by emailing: mann@regmaster.com or v_gold@acm.org.
About CHI 2003
The annual CHI conference is the leading international forum for the exchange of ideas and information about computer-human interaction (CHI), also known as human-computer interaction. See www.chi2003.org.
About ACM
The Association for Computing Machinery (ACM), which sponsors the CHI conference, is a major force in advancing the skills of information technology professionals and students. ACM serves its global membership of 75,000 by delivering cutting edge technical information and transferring ideas from theory to practice. ACM hosts the computing industry’s leading Digital Library and Portal to Computing Literature. With its journals and magazines, special interest groups, conferences, workshops, electronic forums, Career Resource Centre and Professional Development Centre, ACM is a primary resource to the information technology field. For more information, see www.acm.org.
Media Contact
More Information:
http://gtresearchnews.gatech.edu/All latest news from the category: Information Technology
Here you can find a summary of innovations in the fields of information and data processing and up-to-date developments on IT equipment and hardware.
This area covers topics such as IT services, IT architectures, IT management and telecommunications.


Newest articles
Properties of new materials for microchips
… can now be measured well. Reseachers of Delft University of Technology demonstrated measuring performance properties of ultrathin silicon membranes. Making ever smaller and more powerful chips requires new ultrathin…
Floating solar’s potential
… to support sustainable development by addressing climate, water, and energy goals holistically. A new study published this week in Nature Energy raises the potential for floating solar photovoltaics (FPV)…
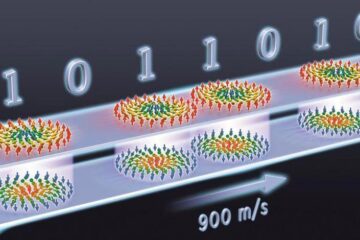
Skyrmions move at record speeds
… a step towards the computing of the future. An international research team led by scientists from the CNRS1 has discovered that the magnetic nanobubbles2 known as skyrmions can be…