New software, HyperTools, transforms complex data into visualizable shapes
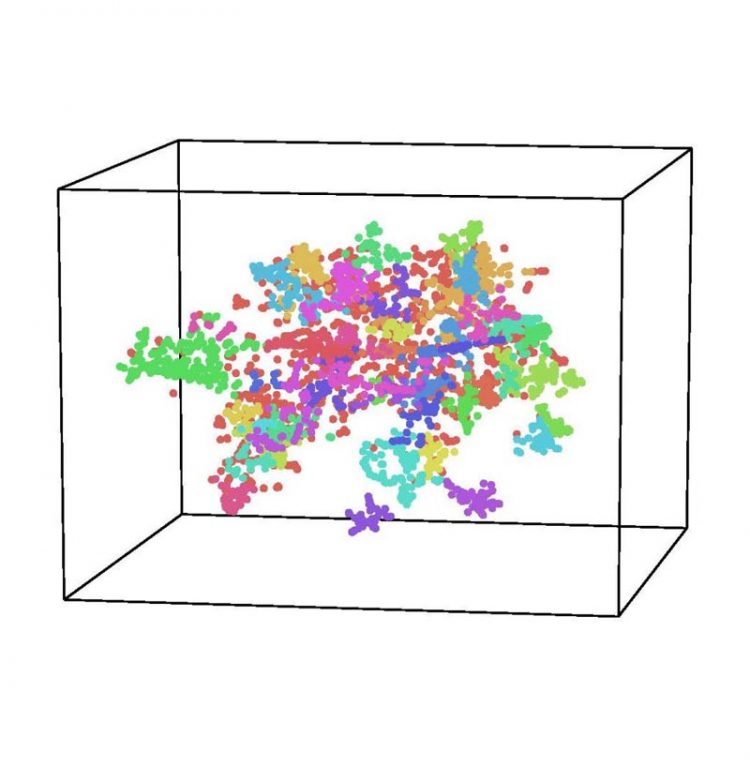
This is a visualization using HyperTools to represent the content of Wikipedia articles. Each dot represents a single Wikipedia article (from a set of 3,000 randomly chosen articles). The dot positions reflect what the articles are about (nearby dots are about similar topics), and the dot colors reflect automatically discovered "clusters" of articles that are about similar themes. To view a 3-D animation of this data (GIF file), go to: http://discovery.dartmouth.edu/~jmanning/hypertools_gifs/wiki.gif Credit: Static image by Contextual Dynamics Laboratory, Dartmouth College
Every dataset in the observable universe has a fundamental geometry or shape to it, but that structure can be highly complicated. To make it easier to visualize complicated datasets, a Dartmouth research team has created HyperTools— an open-source software package that leverages a suite of mathematical techniques to gain intuitions about high-dimensional datasets through the underlying geometric structures they reflect. The findings are published in the Journal of Machine Learning Research.
HyperTools can be used to transform data into visualizable shapes or animations, which can be used to: compare different datasets, gain insights into underlying patterns in an intuitive way, make generalizations across datasets, and develop and test theories relating to the Big Data.
“The datasets we're faced with as modern scientists can be enormously complex, often reflecting many interacting components,” explains senior author, Jeremy R. Manning, an assistant professor of psychological and brain sciences and director of the Contextual Dynamics Lab at Dartmouth.
“Our tool turns complex data into intuitive 3-D shapes that can be visually examined and compared. Essentially, we are leveraging the visual system's amazing ability to find patterns in the world around us to also find patterns in complex scientific data.”
The researchers demonstrate how HyperTools can be applied to various types of data. In the paper, they showcase visualizations of: brain activity, movie frames and brain responses to watching those frames; changes in temperature measurements across the Earth's surface from 1875 to 2013; and the thematic content of political tweets issued by Hillary Clinton and Donald Trump during the 2016 US presidential campaign.
In addition to using HyperTools to directly understand the geometric structure of data, the insights revealed by the tool can also be used to guide the development of machine learning algorithms. For example, the data visualizations can reveal how different types of observations form structured distinct clusters (e.g. Trump tweets vs. Clinton tweets) that could be used to understand the similarities and differences between groups.
As part of the HyperTools toolbox, Manning's lab continues to develop and release other types of geometric visualization analyses, including the recently launched text analyses.
###
Manning is available for comment at: jeremy.r.manning@dartmouth.edu.
The study's other authors include Dartmouth postdoctoral researcher Andrew Heusser and graduate student Kirsten Ziman (lead co-authors) and graduate student Lucy Owen, all members of Manning's lab.
GIFs and hi-res still images are available upon request.
Media Contact
All latest news from the category: Information Technology
Here you can find a summary of innovations in the fields of information and data processing and up-to-date developments on IT equipment and hardware.
This area covers topics such as IT services, IT architectures, IT management and telecommunications.


Newest articles
Silicon Carbide Innovation Alliance to drive industrial-scale semiconductor work
Known for its ability to withstand extreme environments and high voltages, silicon carbide (SiC) is a semiconducting material made up of silicon and carbon atoms arranged into crystals that is…
New SPECT/CT technique shows impressive biomarker identification
…offers increased access for prostate cancer patients. A novel SPECT/CT acquisition method can accurately detect radiopharmaceutical biodistribution in a convenient manner for prostate cancer patients, opening the door for more…
How 3D printers can give robots a soft touch
Soft skin coverings and touch sensors have emerged as a promising feature for robots that are both safer and more intuitive for human interaction, but they are expensive and difficult…